Data Science Machine Learning

Diamond Listings by Valentino Kim Fernando

A comprehensive machine learning study on diamond price prediction — spanning exploratory analysis, classification, regression & unsupervised clustering.

Explore the Project ↓

Dataset Structure

The Diamond Listings (DML) dataset contains rich features across three categories, enabling both supervised and unsupervised learning approaches.

Nominal

Categorical Features

  • Bentuk (Shape)
  • Warna_Dominan_Fancy
  • Warna_Sekunder_Fancy
  • Overtone_Fancy
  • Girdle_Min / Max
  • Ukuran_Culet
  • Warna_Fluoresensi
  • Lab
Ordinal

Ranked Features

  • Warna (Color)
  • Intensitas_Warna_Fancy
  • Kejernihan (Clarity)
  • Potongan (Cut)
  • Simetri (Symmetry)
  • Polesan (Polish)
  • Intensitas_Fluoresensi
Numeric

Continuous Features

  • Ukuran (Carat)
  • Sudut_Crown
  • Sudut_Pavilion
  • Persentase_Depth
  • Persentase_Table
  • Panjang / Lebar / Tebal
  • Harga (Price)
Binary

Boolean Features

  • Kondisi_Culet
  • Eye_Clean
+ Engineered
  • is_fancy
  • ratio_pl
  • volume
  • ML Pipeline

    01
    EDA
    02
    Preprocessing
    03
    Feature Eng.
    04
    Classification
    05
    Regression
    06
    Clustering

    6 Key Insights

    Deep dives into the diamond dataset revealing pricing patterns, shape relationships, and the premium value of fancy color diamonds.

    Figures below are cropped from the final PDF report so the portfolio shows the actual evidence behind each insight.
    01

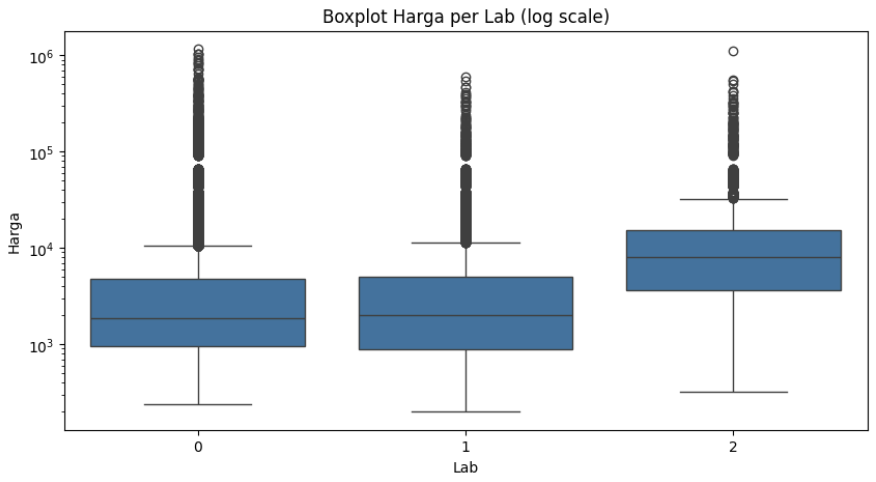
    Lab vs Price Distribution

    Distribution across labs is imbalanced — Lab 0 dominates in volume. Labs 0 and 1 show overlapping price ranges on log scale, while Lab 2 tends to certify higher-value diamonds, with a higher median and upper quartile.

    Lab is a weak price predictor (correlation ≈ 0.06) — it reflects the type of diamond evaluated, not a direct price driver.
    Boxplot of diamond prices by lab on log scale
    PDF visual: price distribution by Lab on log scale.
    02

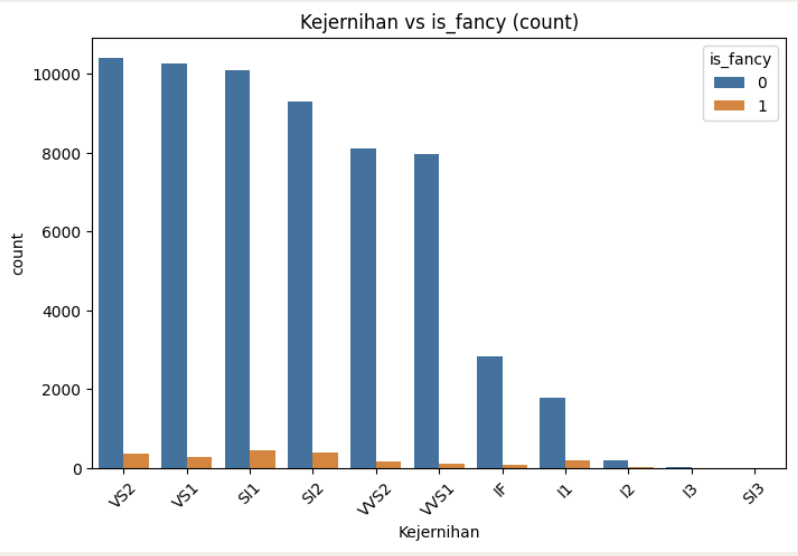
    Clarity: Fancy vs Non-Fancy

    Both fancy and standard diamonds concentrate at VS2, VS1, SI1, SI2 clarity grades. No significant clarity shift exists between groups.

    Fancy color is a visual/color attribute — it does not determine clarity quality.
    Bar chart comparing clarity counts for fancy and non-fancy diamonds
    PDF visual: clarity count split by fancy-color status.
    03

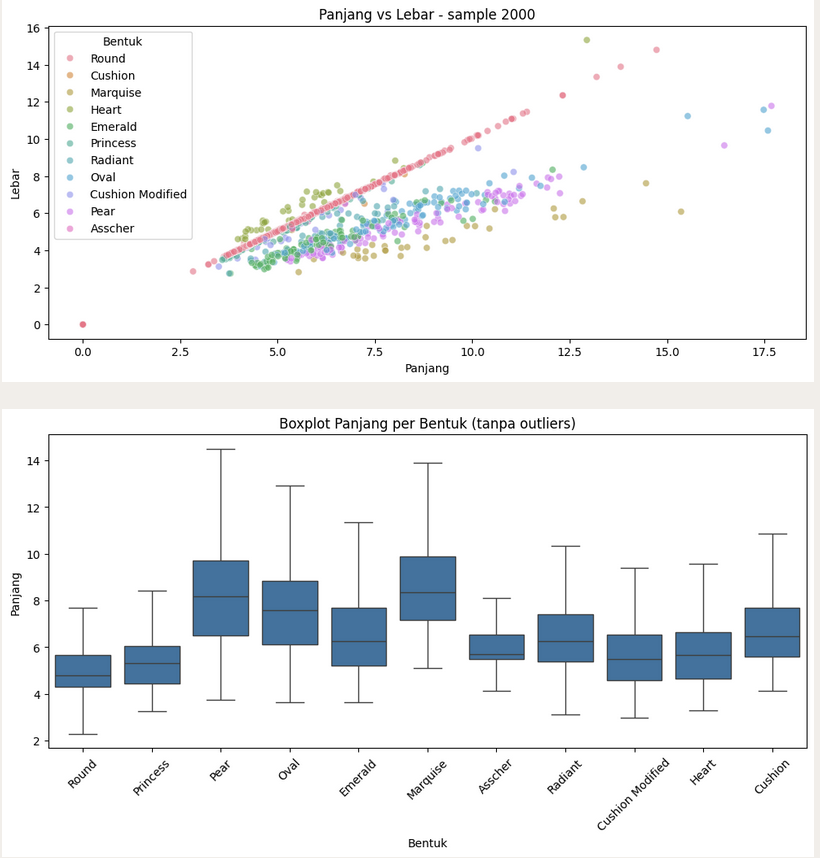
    Shape & Dimension Distribution

    Round cuts show the most symmetric length/width ratio. Elongated cuts (Marquise, Pear, Oval) have much larger length vs width. Princess & Asscher approach square proportions.
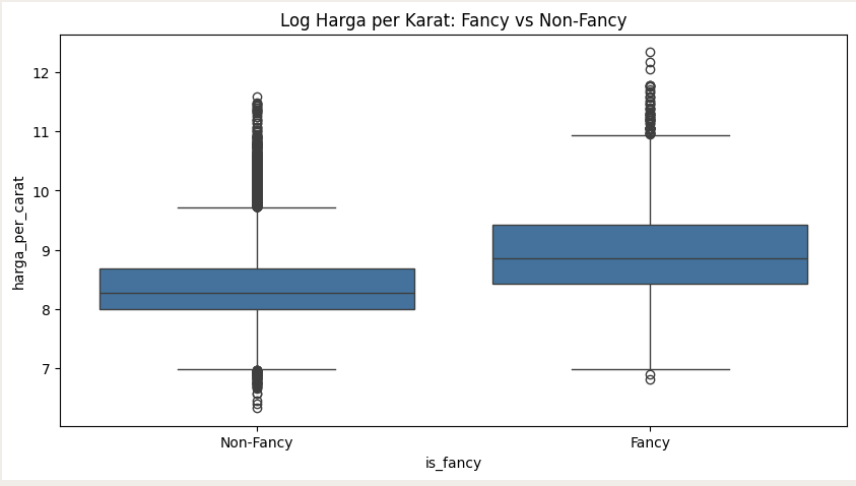
    Elongated cuts have greater size variance; symmetric cuts are more dimensionally consistent.
    Scatter plot and boxplot of diamond length and width by shape
    PDF visual: length-width distribution across diamond shapes.
    04

    Fancy Color Premium

    Fancy color diamonds command a price-per-carat that is over 2× higher on average compared to standard diamonds. The entire distribution shifts upward — not just outliers.

    Fancy color status is the primary driver of premium pricing, independent of physical size.
    Non-Fancy
    ~$3,200/ct
    Fancy
    ~$8,900/ct
    Boxplot of log price per carat for fancy and non-fancy diamonds
    PDF visual: fancy diamonds shift upward in price per carat.
    05

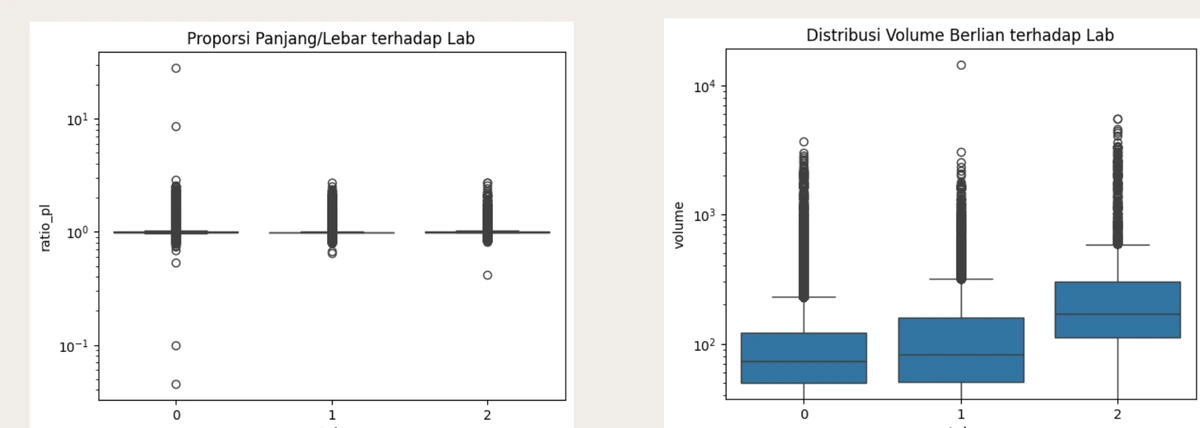
    Dimension Ratios Across Labs

    Length/width ratio is consistent across all three labs (majority near 1:1). However, volume differs notably — Lab 2 handles larger diamonds on average.

    Lab differences are explained by diamond size, not shape proportions.
    Boxplots of length-width ratio and volume across lab categories
    PDF visual: proportions are stable, volume differs by lab.
    06

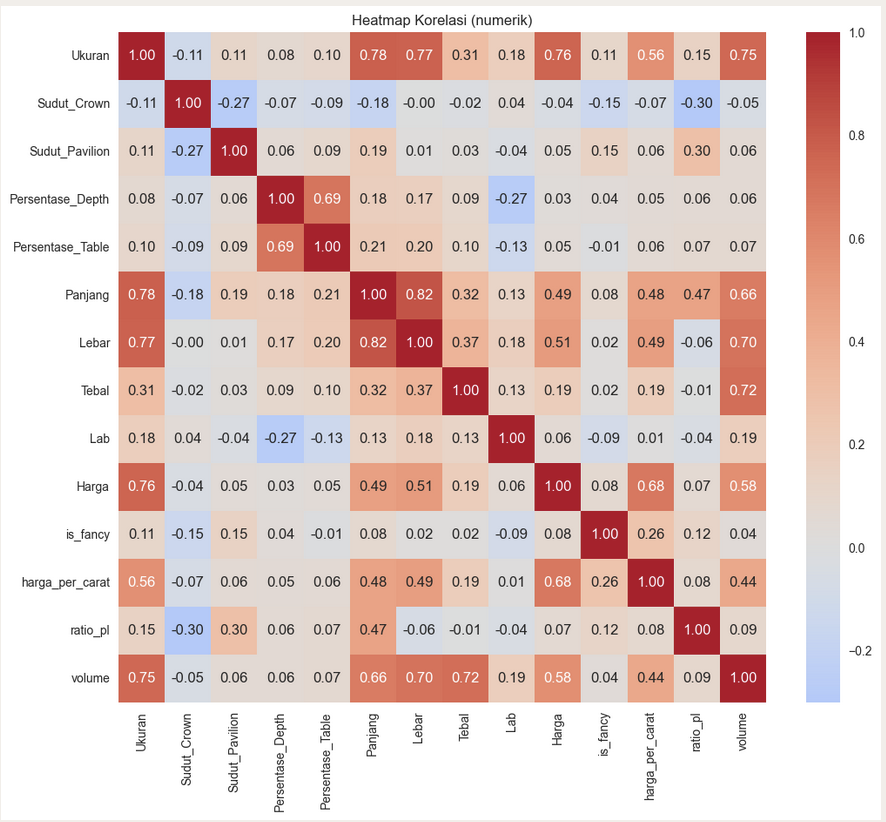
    Correlation Heatmap — Numeric Features

    Carat (Ukuran) shows the strongest correlation with price at r = 0.76. Price-per-carat follows at r = 0.68. Physical dimensions (width 0.51, length 0.49) also contribute significantly.

    Ukuran (Carat)
    0.76
    Harga per Karat
    0.68
    Lebar (Width)
    0.51
    Panjang (Length)
    0.49
    Volume
    0.58
    Tebal (Depth)
    0.19
    Lab
    0.06
    Correlation heatmap of numerical diamond features
    PDF visual: full numeric correlation heatmap.
    Diamond price is primarily determined by carat weight and physical dimensions — not by the grading lab.

    8-Step Pipeline

    01

    Handle Impossible Zeros

    Columns Panjang, Lebar, Tebal, Persentase_Depth, Persentase_Table cannot be zero — replaced with NaN for proper imputation.

    02

    Drop High-Missing Columns

    5 columns with >90% missing values dropped: Warna_Dominan_Fancy, Warna_Sekunder_Fancy, Overtone_Fancy, Intensitas_Warna_Fancy, Warna_Fluoresensi.

    03

    Numeric Imputation

    Skewed features → median imputation. Normally distributed features → mean imputation. Determined using absolute skew threshold of 1.

    04

    Categorical Imputation

    Categorical features imputed with mode. Ordinal features encoded with OrdinalEncoder respecting quality order (e.g., Cut: Fair → Ideal).

    05

    IQR Outlier Capping

    Extreme values capped at IQR bounds (Q1 − 1.5×IQR, Q3 + 1.5×IQR) instead of dropped — preserving sample integrity while neutralizing outlier influence.

    06

    MinMax Scaling

    Numeric features normalized to [0, 1] using MinMaxScaler: Ukuran, Panjang, Lebar, Tebal, Persentase_Depth, Persentase_Table, Sudut_Crown, Sudut_Pavilion, ratio_pl, volume.

    07

    One-Hot Encoding

    Nominal categorical features encoded using pd.get_dummies with drop_first=True to avoid multicollinearity. Applied consistently across train, val, and test sets.

    08

    High-Missing → Unknown

    Categorical features with >60% missing filled with "Unknown" instead of being dropped — preserving feature availability while flagging uncertainty.

    Visual QA

    Outlier Capping Before → After

    The PDF shows how IQR capping compresses extreme values without deleting records, making the modeling pipeline more stable while preserving sample count.

    Before and after boxplots showing IQR outlier capping
    PDF visual: numeric outliers before and after capping.

    3 Engineered Features

    Binary is_fancy

    Created from Warna_Dominan_Fancy — detects whether a diamond is fancy color. EDA confirms fancy diamonds have price-per-carat 2× higher, making this binary signal critical for the model.

    train['is_fancy'] = train['Warna_Dominan_Fancy'].notna().astype(int)
    Ratio ratio_pl

    Length-to-width ratio captures geometric shape information quantitatively. Elongated cuts (Marquise, Pear, Oval) produce high ratios; symmetric cuts (Round, Princess) cluster near 1.0.

    train['ratio_pl'] = train['Panjang'] / train['Lebar']
    Volume volume

    Combines length × width × depth into a single physical size estimator. Correlation with price is r = 0.58 — more representative than any individual dimension alone.

    train['volume'] = train['Panjang'] * train['Lebar'] * train['Tebal']
    Features Dropped in Selection: Sudut_Crown, Sudut_Pavilion, Harga, Panjang, Lebar — removed to eliminate data leakage and redundancy after engineering.

    Classification & Regression

    Classification F1 Macro
    CatBoost
    0.8142
    LightGBM
    0.770
    XGBoost
    0.770
    Random Forest
    0.7593
    Stacking RF+LR
    0.758
    KNN
    0.640
    Regression R² Score
    Stacking Ensemble
    0.9888
    XGBoost
    0.9796
    HistGradient
    0.9792
    CatBoost
    0.9032
    LightGBM
    0.8633
    MLP
    0.802

    Classification — Lab Prediction

    5-Fold Cross Validation
    # Model F1 Macro Precision Recall Rank
    1 CatBoost 0.8142 0.763 0.876 Best
    2 LightGBM 0.770 0.757 0.787 2nd
    3 XGBoost 0.770 0.820 0.730 2nd
    4 Random Forest 0.7593 0.7246 0.8341
    5 Stacking (RF + LR) 0.758 0.721 0.8474
    6 KNN 0.640 0.690 0.610
    View original PDF evaluation table
    Original classification evaluation table from PDF
    PDF visual: 5-fold CV classification results.
    🏆 Kaggle Public Leaderboard
    CatBoost Final 0.84809

    Ranked 1st on public leaderboard for classification task

    Regression — Price Prediction

    5-Fold Cross Validation
    # Model MAE RMSE Rank
    5 Stacking (XGB+LGBM+CB+Ridge) 0.9888 Best
    4 XGBoostRegressor 0.9796 2nd
    3 HistGradientBoosting 0.9792
    1 CatBoostRegressor 0.9032 981.57 8141.03
    2 LightGBMRegressor 0.8633 1100.47 9562.85
    7 Multi Layer Perceptron 0.802 166.13 3177.03
    6 Linear Regression -22.47 1574.39
    8 Lasso Regression -22.16 1458 16382
    View original PDF evaluation table
    Original regression evaluation table from PDF
    PDF visual: 5-fold CV regression results.
    🏆 Kaggle Public Leaderboard
    Stacking Ensemble 0.93538

    Ranked 1st on public leaderboard for regression task

    Why CatBoost Won Classification

    CatBoost handles categorical features natively without extensive preprocessing, and its ordered boosting prevents target leakage — particularly useful for this imbalanced, multi-class lab prediction task.

    Why Stacking Won Regression

    No single model captures all nonlinear price patterns. Stacking XGBoost + LightGBM + CatBoost with a Ridge meta-learner achieves R² = 0.9888 by combining the strengths of diverse gradient boosting strategies.

    Linear Models Failed

    Linear Regression and Lasso achieved negative R² values, confirming that diamond pricing is highly nonlinear — driven by complex interactions between carat, clarity, cut, color, and fancy status.

    Unsupervised Segmentation

    Four clustering algorithms applied to discover natural groupings in the diamond dataset, all converging on k=2 as the optimal structure.

    K-Means

    Optimal k2
    Silhouette0.320

    Elbow method suggested candidates at k = 2, 3, 4, 6. Silhouette score peaked at k = 2 (0.320), though the dataset's high variance is reflected in the moderate score.

    K-Means elbow method chart
    Elbow method evidence from the PDF.

    Agglomerative

    Optimal k2
    MethodDendrogram

    Dendrogram visualization clearly revealed two dominant vertical branches, confirming k = 2 as the most natural hierarchical split in the bottom-up clustering structure.

    Agglomerative clustering dendrogram
    Dendrogram evidence from the PDF.

    DBSCAN

    Optimal eps2.0
    Silhouette0.266
    Noise ratio0.04%

    PCA-assisted exploration across eps values. At eps=2.0, 2 clusters formed with minimal noise (0.04%). Smaller eps values caused fragmentation; larger values merged all points.

    DBSCAN epsilon comparison table
    DBSCAN eps comparison from the PDF.

    Gaussian Mixture

    Optimal n2
    CriterionBIC + AIC

    Sharp BIC/AIC drop at n=2 confirmed two Gaussian components as optimal. GMM's soft clustering assigns probabilistic membership — suitable for diamonds straddling two market segments.

    Gaussian Mixture Model BIC and AIC line chart
    BIC/AIC model-selection chart from the PDF.

    Clustering Conclusion

    All four algorithms independently converge on k = 2 clusters, strongly suggesting the diamond market naturally segments into two groups — most likely aligned with the fancy color vs. non-fancy distinction uncovered in EDA. This unsupervised result validates the domain-driven is_fancy feature engineered for supervised models.

    Key Takeaways

    01

    Carat is King

    Physical size (carat, volume, dimensions) dominates price prediction with correlation up to 0.76.

    02

    Fancy Color = Premium

    Fancy diamonds command 2× price-per-carat. The is_fancy feature became one of the most valuable signals.

    03

    Gradient Boosting Dominates

    Tree-based ensemble models (CatBoost, XGBoost, LightGBM) outperformed linear and neural models on this structured dataset.

    04

    Stacking > Single Models

    The ensemble stacking approach achieved R² = 0.9888, outperforming every individual regressor significantly.

    05

    Lab Reflects, Not Determines

    Lab certification correlates weakly (r=0.06) with price — labs certify different diamond types, not different quality standards.

    06

    2 Natural Segments

    All clustering methods converge on k=2, validating the fancy/non-fancy market split through unsupervised learning.